Data analysts collect, organize, and scrutinize data using specialist tools to help companies or individuals make sense of information and drive smarter decision-making. Data analysts can work in different types of industries IT, finance, medical, government, manufacturing, education, and many more .

What kind of Work Data Analyst Do?
Data analysts can play a major role in modern companies. As a data analyst, it’s our responsibility to turn raw data into meaningful insights. We collect data using software, surveys, and other data collection tools, perform statistical analyses on data, and interpret information gathered to inform critical business decisions. Many Organizations have also created different information analyst teams, with data-focused roles including database administrators, data scientists, data architects, database managers, data engineers, and, of course, data analysts.
STAFF
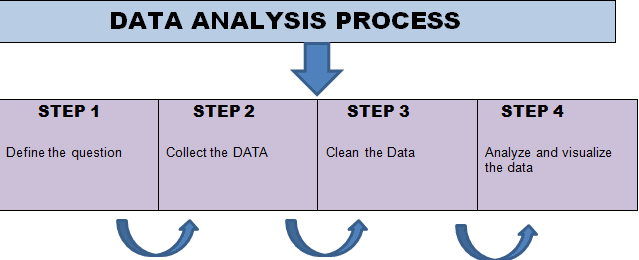
- Define the question
- Collecting Data
- Data Cleaning
- Analyzing and Visualize Data
Defining a question
Initially, we need to define our objective. In some ways, this is the hardest part of the process. This is because what seems like an obvious problem may not always get to the core of an issue.
For example, let us work for a company that wants to boost its revenue. The management is set on doing this by launching a suite of new Data Services. As a result, we spend lots of time and resources analyzing what exact Data to create, which market to launch them in, and so on.
Collecting Data
In Statistics, data collection is a process of gathering information whether from primary research or secondary research from all the relevant sources to find a solution for the specific relevant data. It helps to evaluate the outcome of the problem. The data collection methods allow a person to conclude an answer to the relevant question. Most of the organizations use data collection methods to make assumptions about future probabilities and trends. Once the data is collected, it is necessary to undergo the process.
There are different types of data collection methods :
- Primary Data Collection Methods
- Secondary Data Collection Methods
- Qualitative Data Collection Methods
- Qualitative Data Collection Methods
Data Cleaning
Fresh collected will always be in the raw data format. This means this data is not been organized, checked and also to remove duplicates value if required. To get it into a state that’s suitable for analysis, the data need cleaning. Different types of tools and techniques (such as custom algorithms, generic software, and exploratory analyses) are required for making perfect and errorless data.
Analyzing and Visualize Data
Analytics is a broad term that emphasizes numerous subfields. It refers to all the tools and activities involved in processing data to develop valuable insights and interpretations. It is worth noting that Data Analytics is dependent on computer tools and software that help extract data and analyze them for business decisions to be made accordingly.
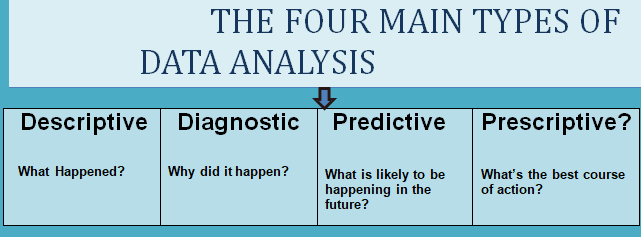
The Types of Data Analysis are :
1 . Quantitative Data Analysis :
This type of analysis lets you see the patterns and trends in a specific set of data. This process includes statistical and calculating frequencies, percentages, and measures of central tendency, including mean, mode, and median.
2 . Qualitative Data Analysis :
Qualitative is the complete opposite, dealing with non-numeric data such as audio, video recordings, images, texts, and transit, ribs. In addition, Qualitative Data generally tells us how our data is changing simultaneously
What is Data Visualization?
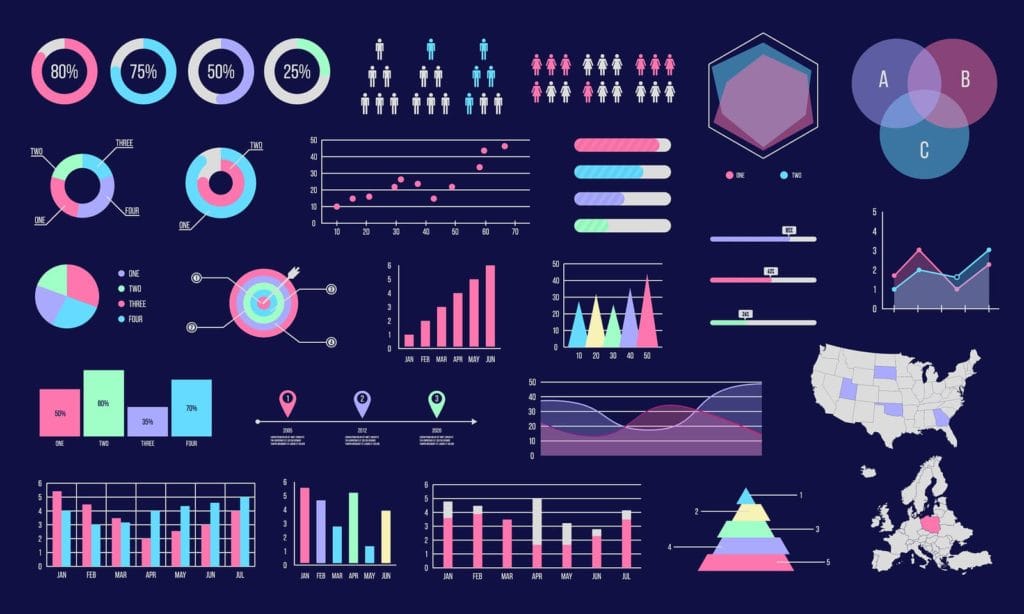
Data Visualization normally deals with picturing the information to develop trends and conclusions of specific requirements. In Data Visualization, information is organized into charts, graphs, Histograms, and other forms of visual representations. This simplifies otherwise complicated information and makes it accessible to all the involved stakeholders to make critical business decisions.
What are the different types of Data Visualization Techniques
- Histograms
- Graphs
- Fever Charts
- Heatmap Visualization
- Infographics
- Pie chart
